Apr 19, 2024
Crowdfunding
Crypto Crowdfunding: Redefining the Future of Fundraising Platforms
Why we believe that crypto crowdfunding will continue to grow in...
Read moreThe crowdfunding industry continues to see strong growth which gives life to more great ideas, projects and social good. At GoGetFunding, month-on-month we’ve had more people raising more money for all types of campaigns. From creative projects and volunteering campaigns to medical fundraisers and more. To help visualize the growth of the crowdfunding […]

Share article:


The crowdfunding industry continues to see strong growth which gives life to more great ideas, projects and social good.
At GoGetFunding, month-on-month we’ve had more people raising more money for all types of campaigns. From creative projects and volunteering campaigns to medical fundraisers and more.
To help visualize the growth of the crowdfunding industry, we created the following infographic which we hope you enjoy:
You are welcome to publish this infographic on your own blog or website, but please remember to link back and credit GoGetFunding .
Inforgraphic data:
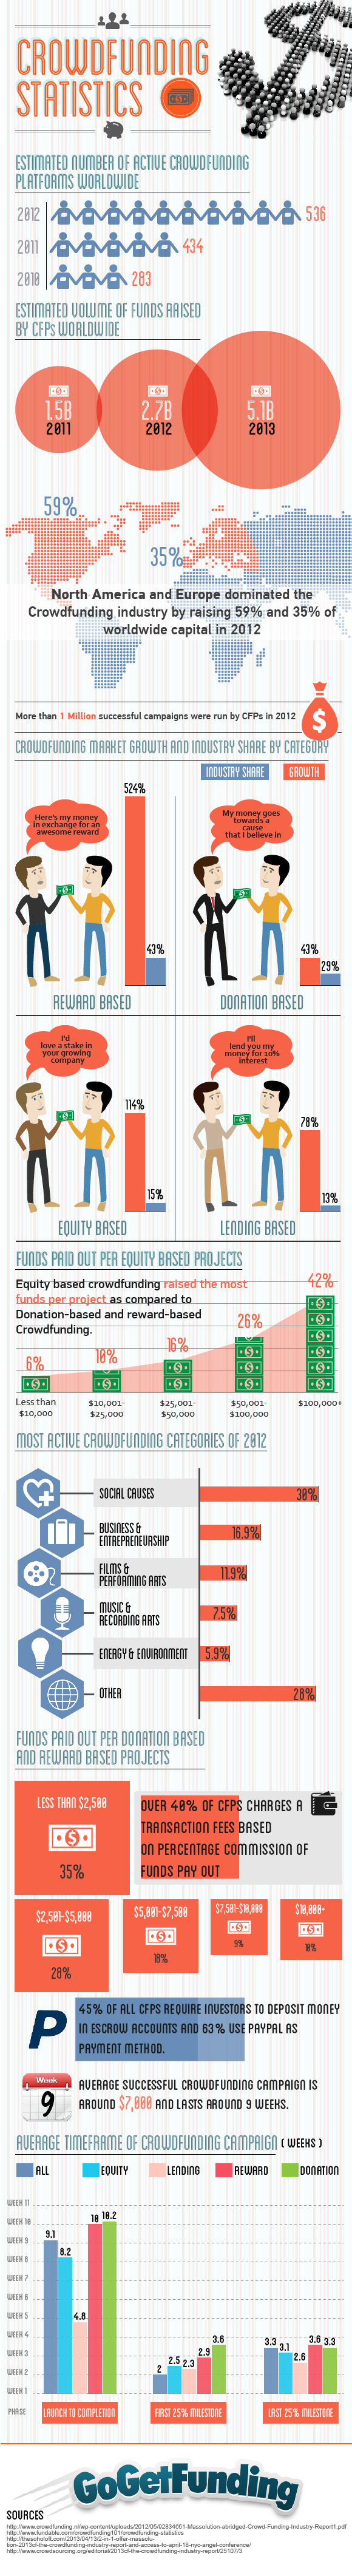
Estimated number of active Crowdfunding Platforms worldwide
| Year | Active CFPs Worldwide |
| 2012 | 536 |
| 2011 | 434 |
| 2010 | 283 |
Estimated volume of funds raised by CFPs worldwide
| Year | Funds raised worldwide (in billions) |
| 2011 | 1.5 |
| 2012 | 2.7 |
| 2013 | 5.1 |
North America and Europe dominated the Crowdfunding industry by raising 59% and 35% of worldwide capital raised in 2012
More than 1 Million successful campaigns were run by CFPs in 2012
Crowdfunding market growth and share by category
| Crowdfunding Category | Share %age | Growth %age ( CAGR) |
| Reward Based Crowdfunding | 43% | 524% |
| Donation Based Crowdfunding | 29% | 43% |
| Equity Based Crowdfunding | 15% | 114% |
| Lending Based Crowdfunding | 13% | 78% |
Equity-based Crowdfunding raises the largest amount of funds per project as compared to Donation-based and reward-based Crowdfunding
Funds paid out per Equity Based Project
| Funds paid out per project | %age |
| Less than $10,000 | 6% |
| $10,0001-$25,000 | 10% |
| $25,001-$50,000 | 16% |
| $50,001-$100,000 | 26% |
| $100,000+ | 42% |
Most active Crowdfunding categories of 2012
| Category | %age |
| Social Causes | 30% |
| Business & Entrepreneurship | 16.9% |
| Films & Performing Arts | 11.9% |
| Music & Recording Arts | 7.5% |
| Energy & Environment | 5.9% |
| Others | 28% |
Funds paid out per Donation Based and Reward Based Project
| Funds paid out per project | %age |
| Less than $2,500 | 35% |
| $2,501-$5,000 | 28% |
| $5,001-$7,500 | 18% |
| $7,501-$10,000 | 9% |
| $10,000+ | 10% |
Over 40% of CFPs charges a transaction fees based on percentage commission of funds pay out
45% of all CFPs require investors to deposit money in Escrow accounts and 63% use Paypal as payment method.
Average successful Crowdfunding campaign is around $7,000 and lasts around 9 weeks
Average timeframe of Crowdfunding campaign
| Pharse | All (in weeks) | Equity Based (in weeks) | Lending Based (in weeks) | Reward Based (in weeks) | Donation Based (in weeks) |
| Launch to completion | 9.1 | 8.2 | 4.8 | 10.0 | 10.2 |
| First 25% milestone | 2 | 2.5 | 2.3 | 2.9 | 3.6 |
| Last 25% milestone | 3.3 | 3.1 | 2.6 | 3.6 | 3.3 |
Note: comments and shares on this post have been reset as the post needed to be migrated to our new blog.


Why we believe that crypto crowdfunding will continue to grow in...
Read moreEmbrace the Future of Personal Fundraising: Introducing Bitcoin on...
Read moreCrowdfunding a wedding is becoming an increasingly popular way for couples to...
Read moreDo you really want to delete your account? This process cannot be undone.


or use your email account:
or use your email for registration:
Сomments
Thanks for sharing.
Thanks for sharing .